This article will help you to
- understand the channel dashboard
- engage users
- understand the global dashboard
Get a full overview of your channel and platform activity, track progress and take action with the channel and the global dashboard.
The channel dashboard
Each channel has a unique dashboard. This allows each channel owner to track the progress of their channel and take action to engage their audience.
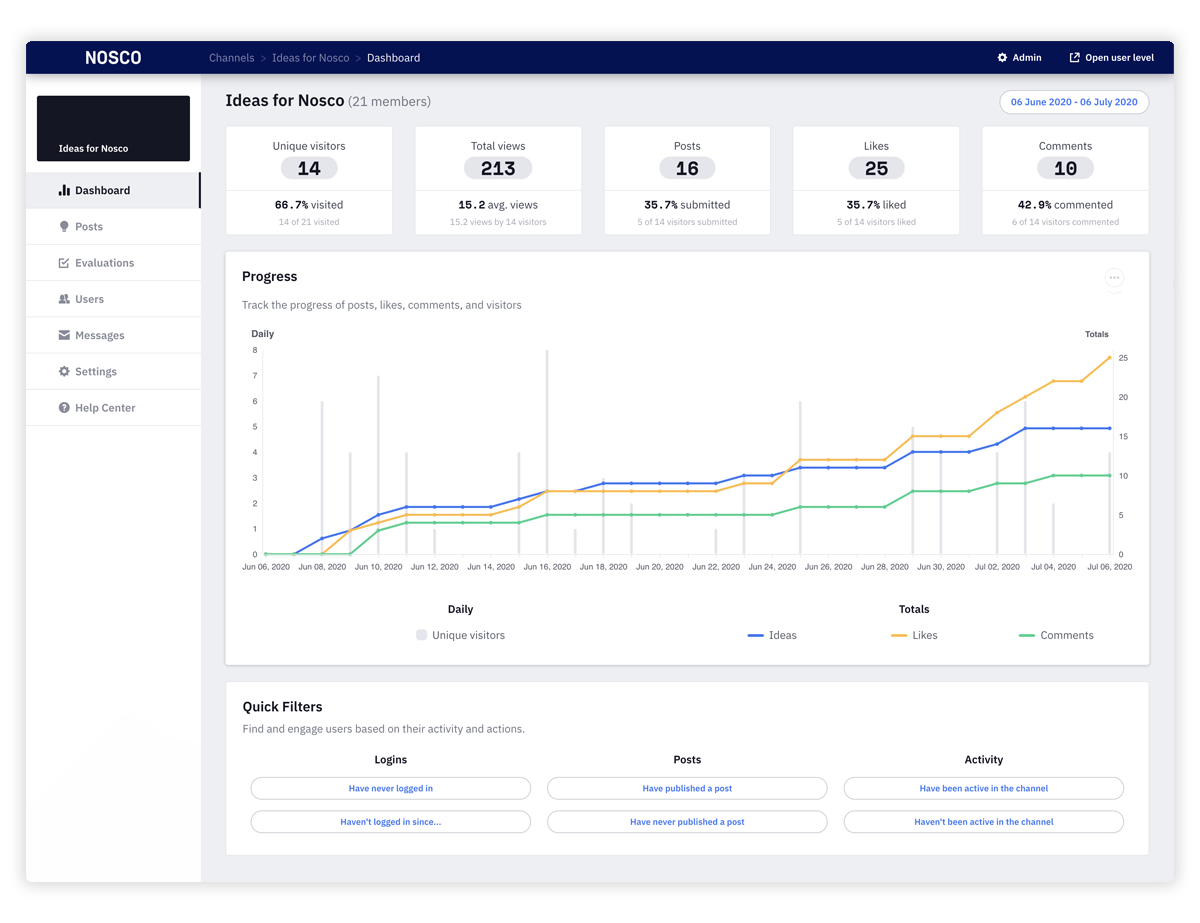
- Click on Admin and then on the channelin which you want to see the dashboard.
- Now click on Dashboard in the left side navigation.
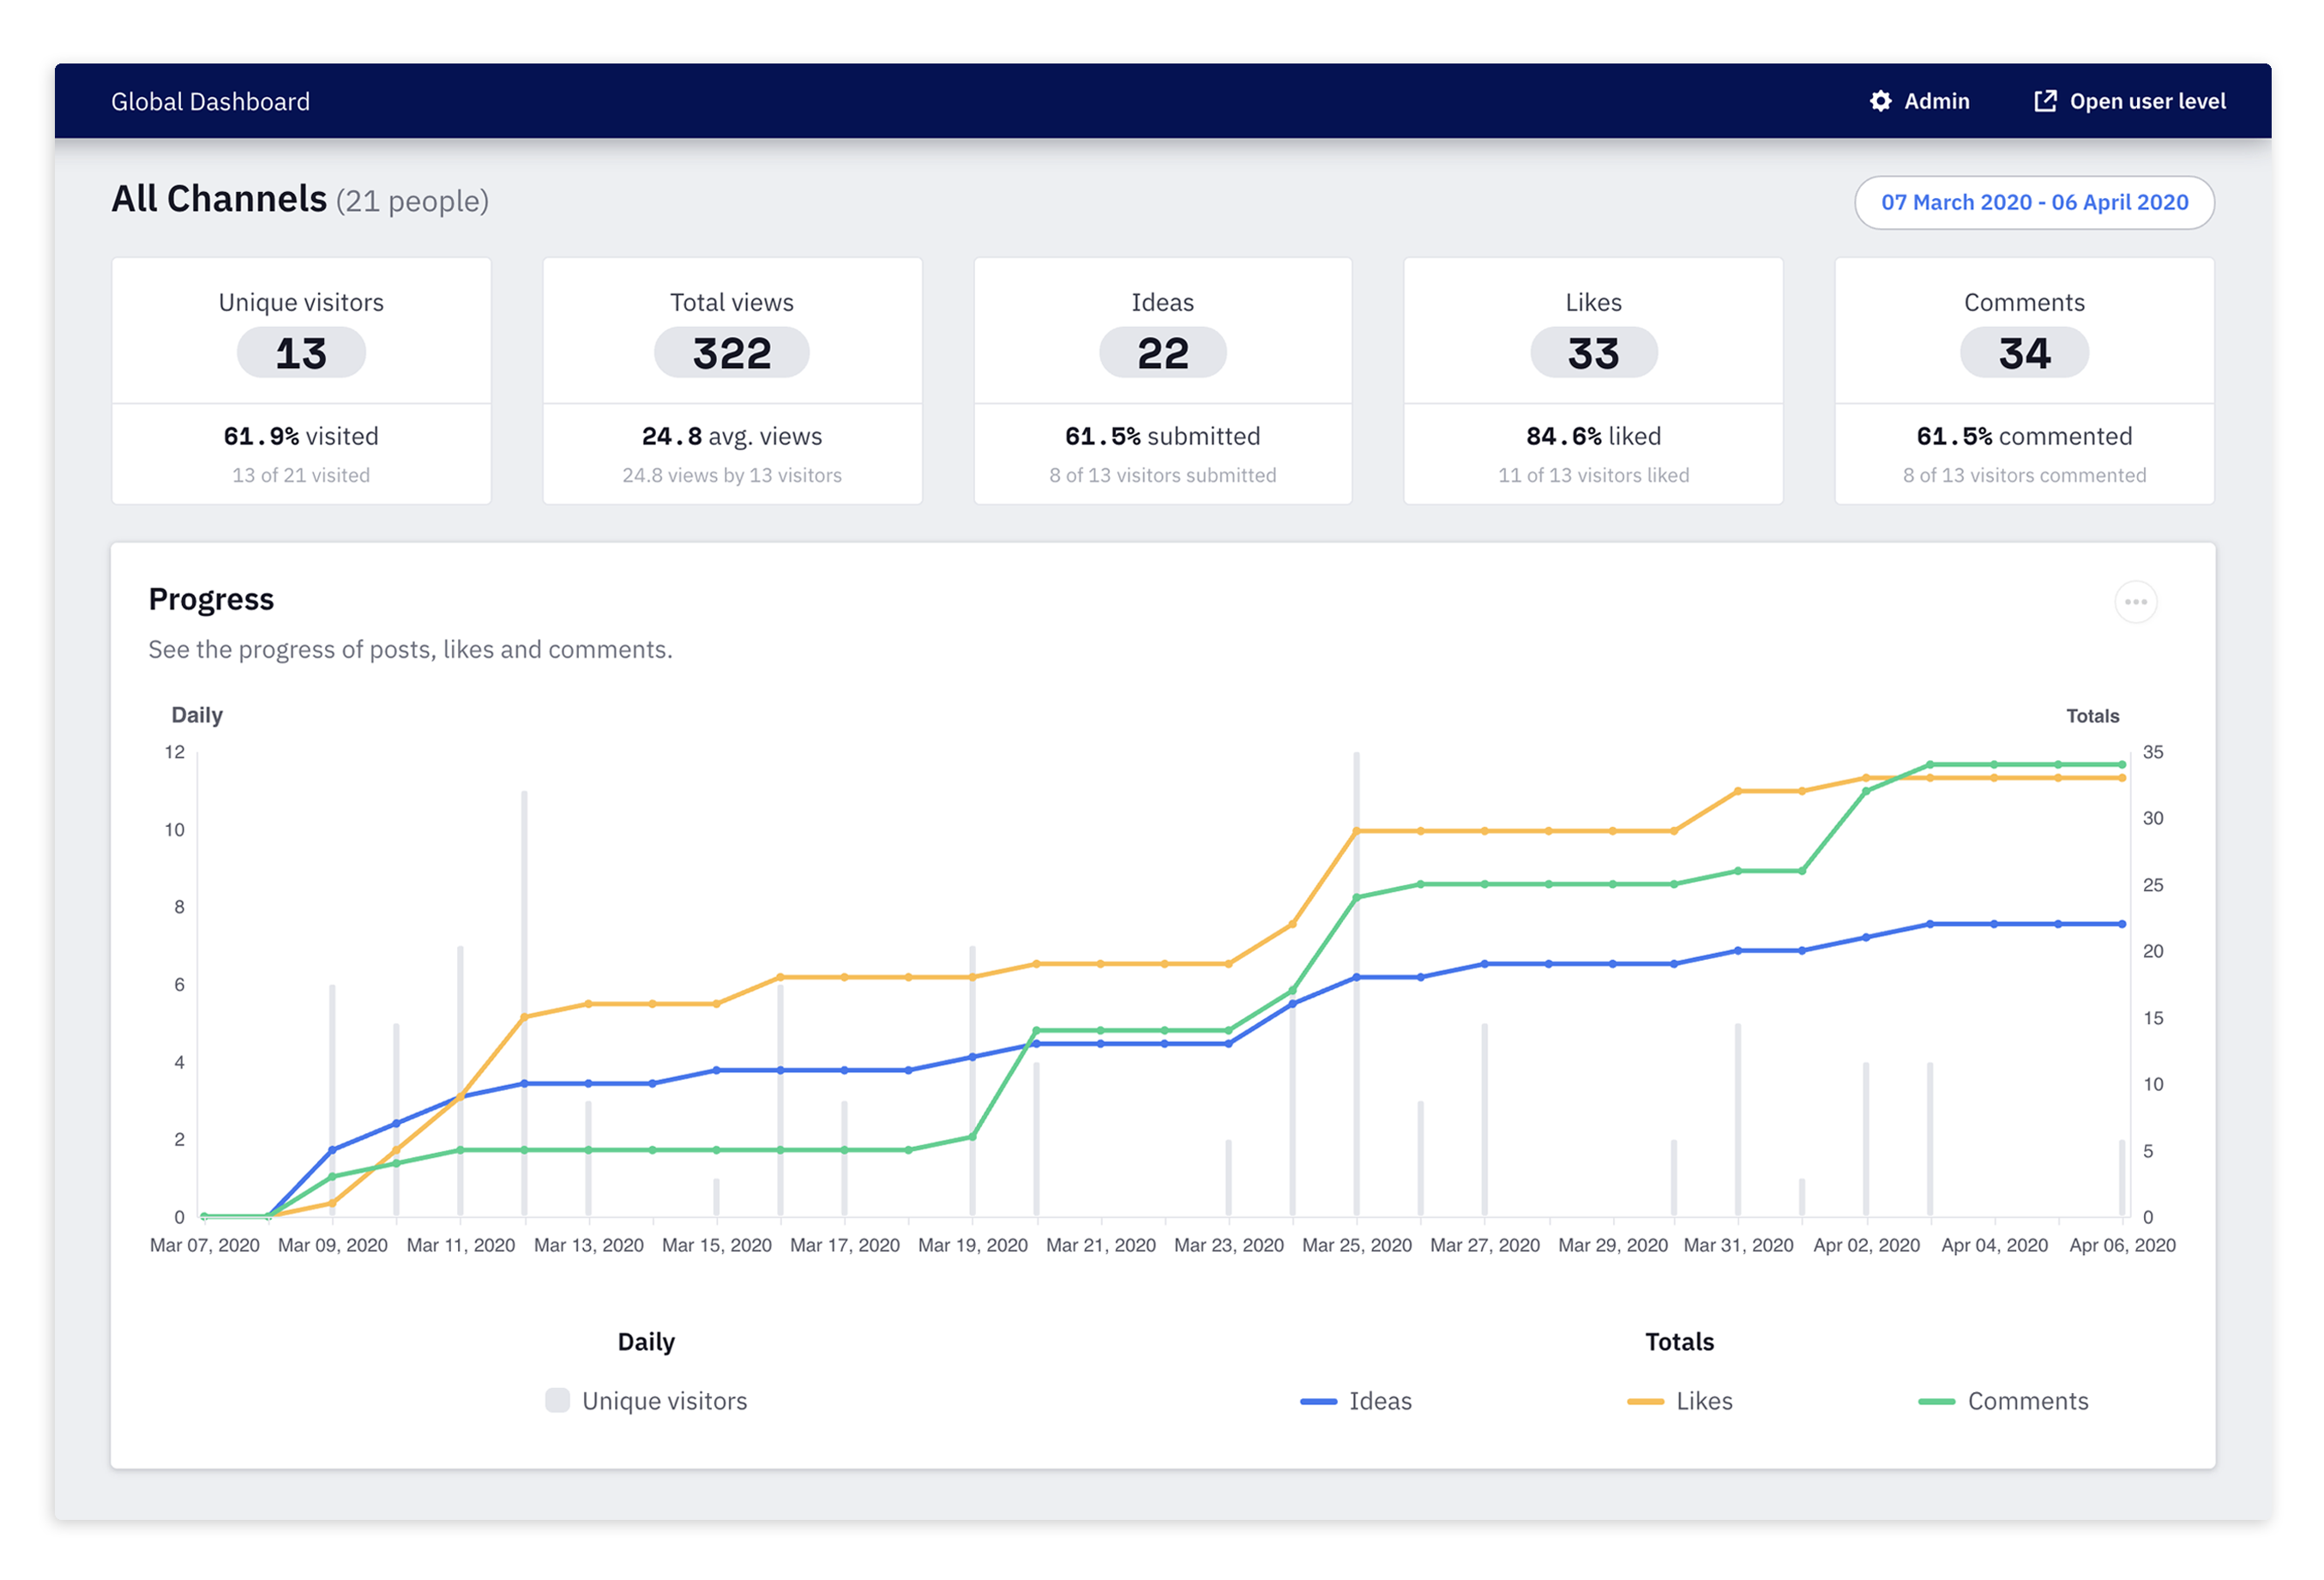
Get a full overview
Get a complete overview of how many ideas, comments, or likes have been submitted and how big your audience is.
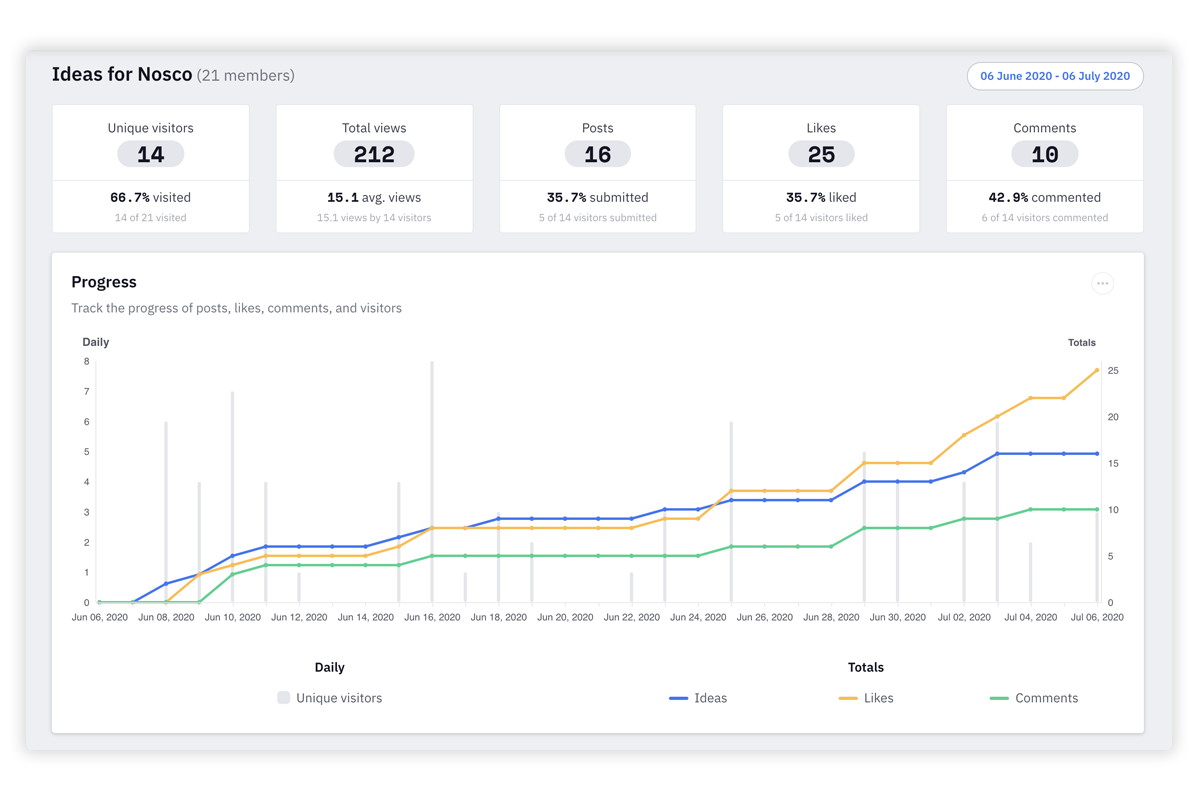
Track your progress
Follow the progress of your channel. See how many people have visited the channel and how many ideas, comments, and likes have been submitted over time.
Use the date picker to see the progress in a specific period of time.
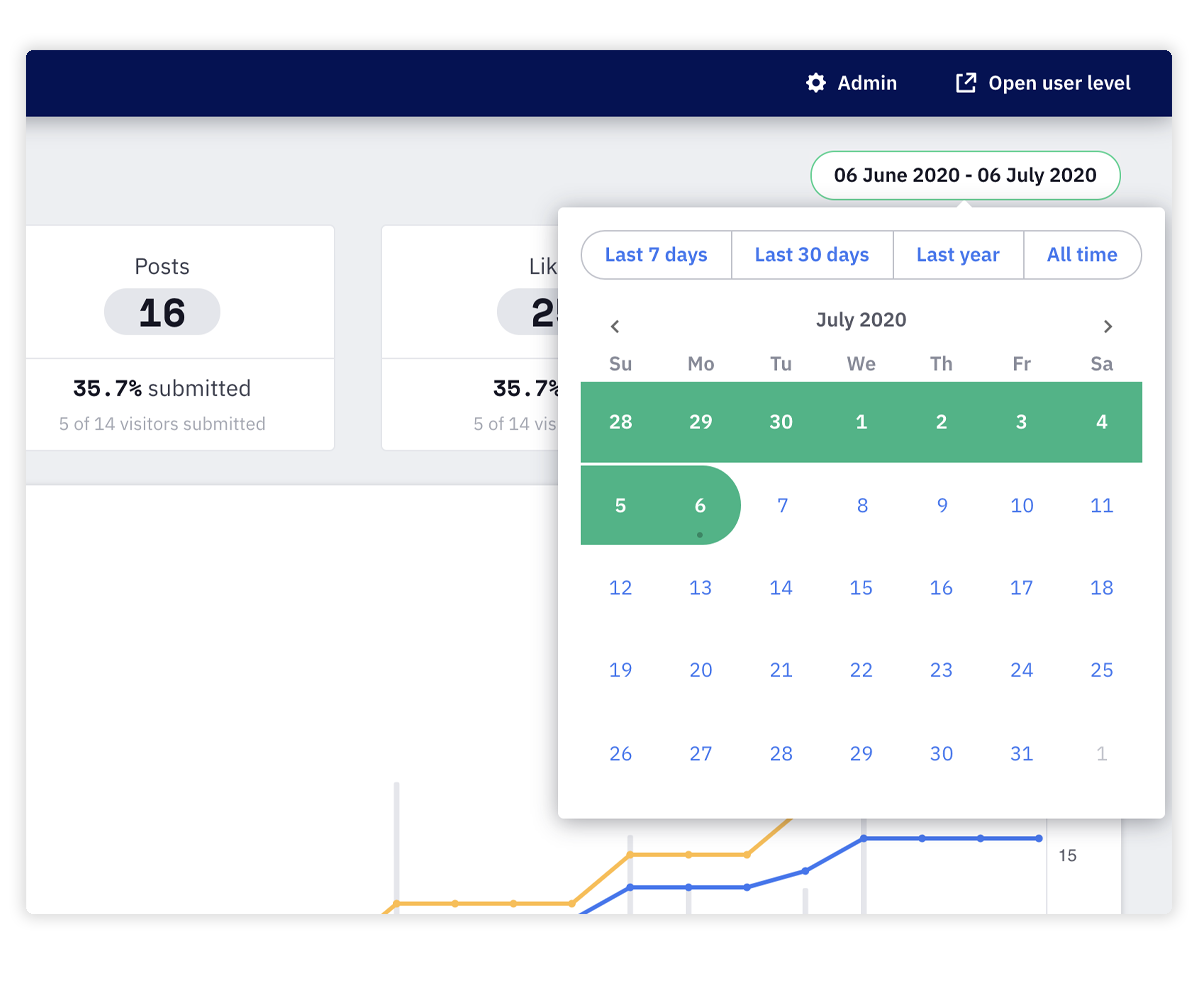
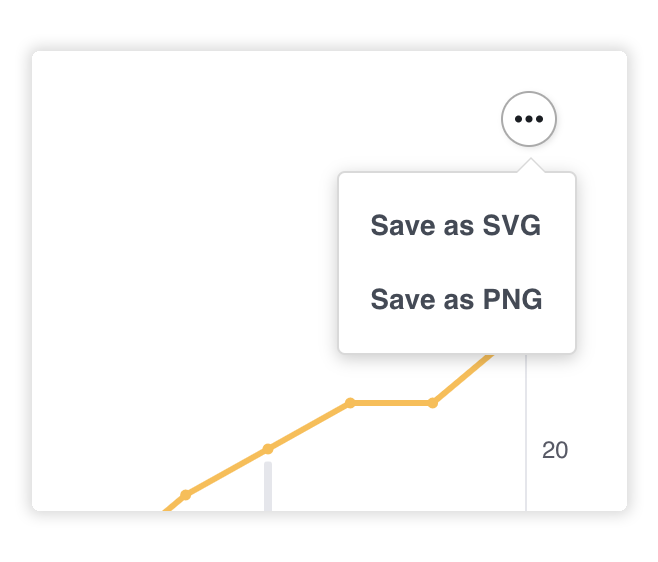
Save the chart as an image (PNG, SVG) and add it to your presentations or reporting.
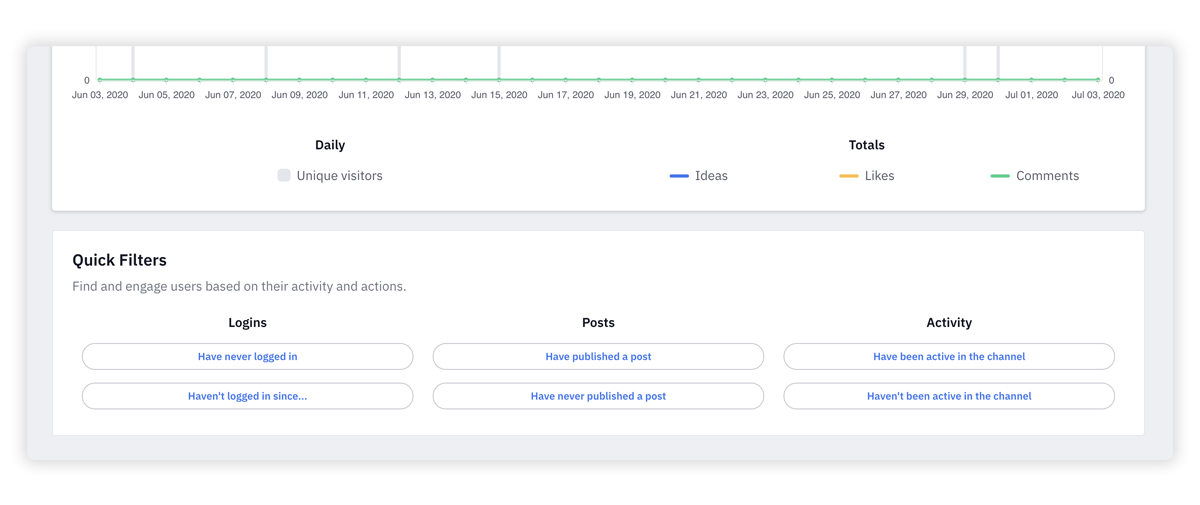
Engage users
Make calculated decisions based on your channel's progress and take action to activate and engage your audience. Use the predefined quick-filter to easily find and engage the right user group.
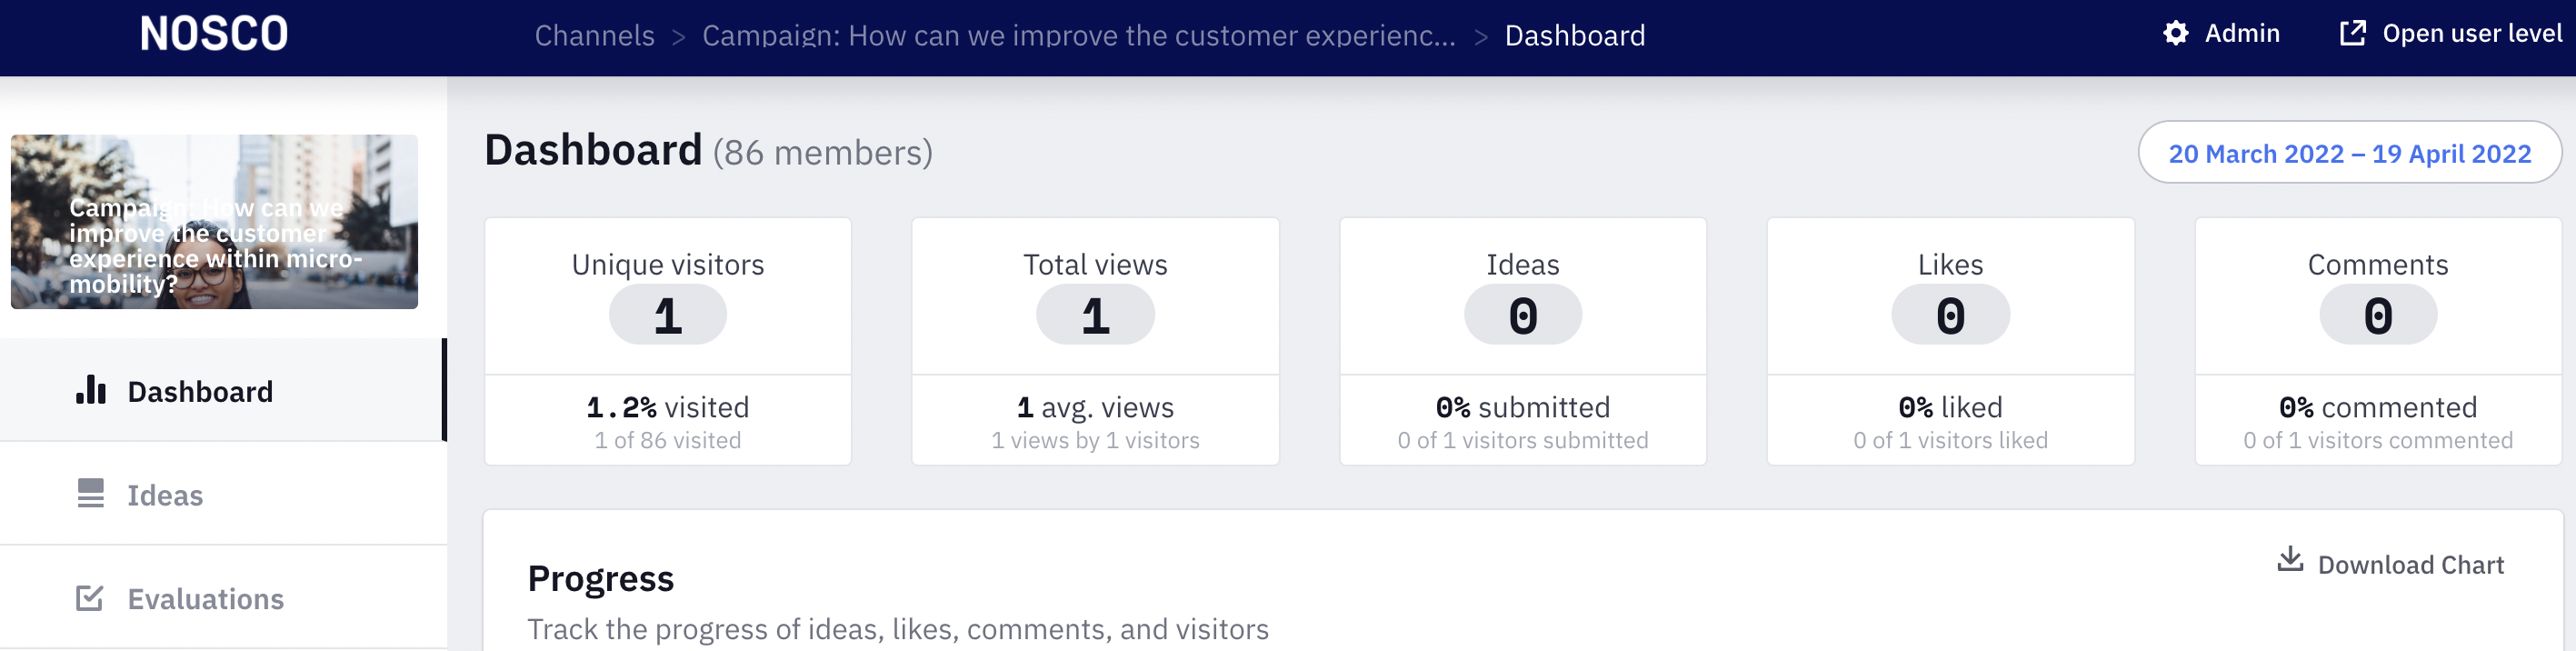
The global dashboard
The global dashboard gives you a full overview of your platform activity across channels. See how ideas, likes and comments are progressing and how many users have visited the platform.
- Click on Admin and then on Dashboard.
Get a full overview
Get a complete overview of how many ideas, comments or likes have been submitted and how big your audience is.
Track your progress
Follow the progress of your platform. See how many people have visited the platform and how many ideas, comments, and likes have been submitted over time.
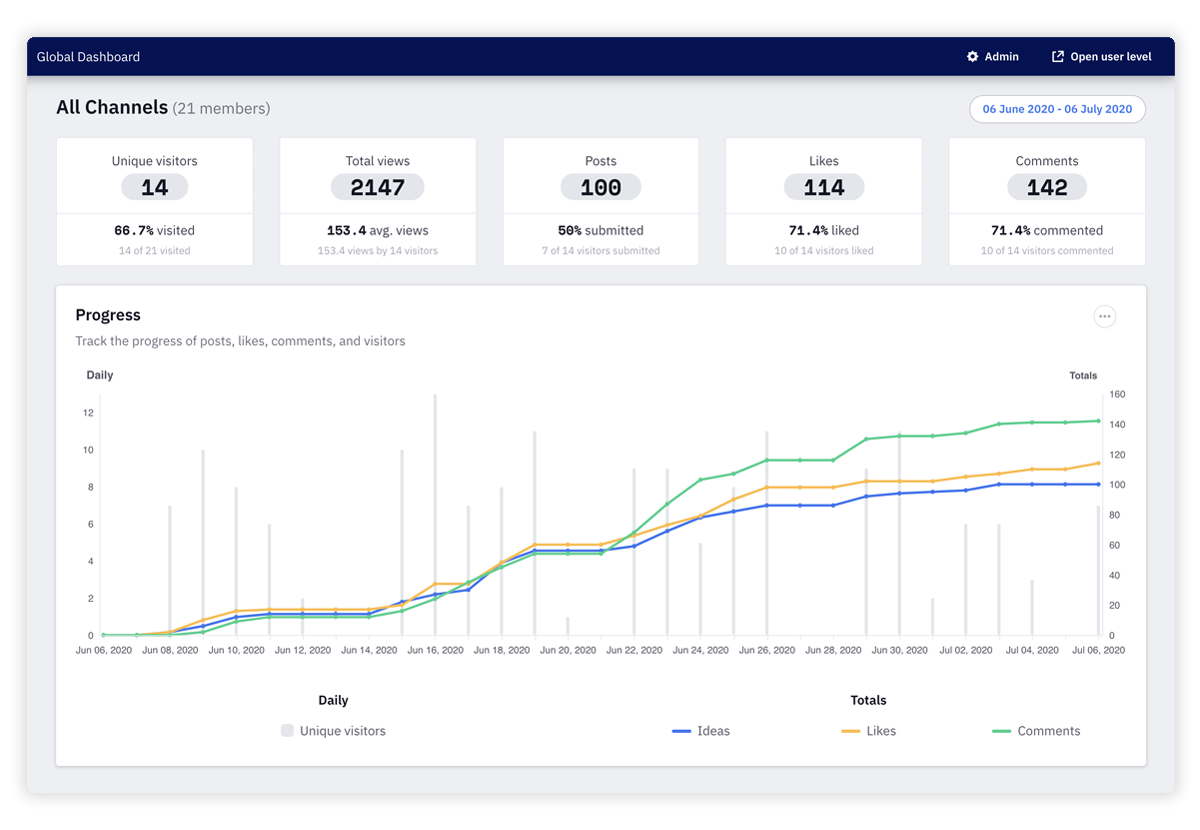
Use the date picker to see the progress in a specific period of time.
Save the chart as an image (PNG, SVG) and add it to your presentations or reporting.
We hope this article has been useful for you.
**If you need more help,**feel free to reach us: